> ## Documentation Index
> Fetch the complete documentation index at: https://grandcentral.backbase.io/llms.txt
> Use this file to discover all available pages before exploring further.
# Monitor your integrations
> Use the Grand Central console dashboard to see deployed packs and connector health for your selected runtime.
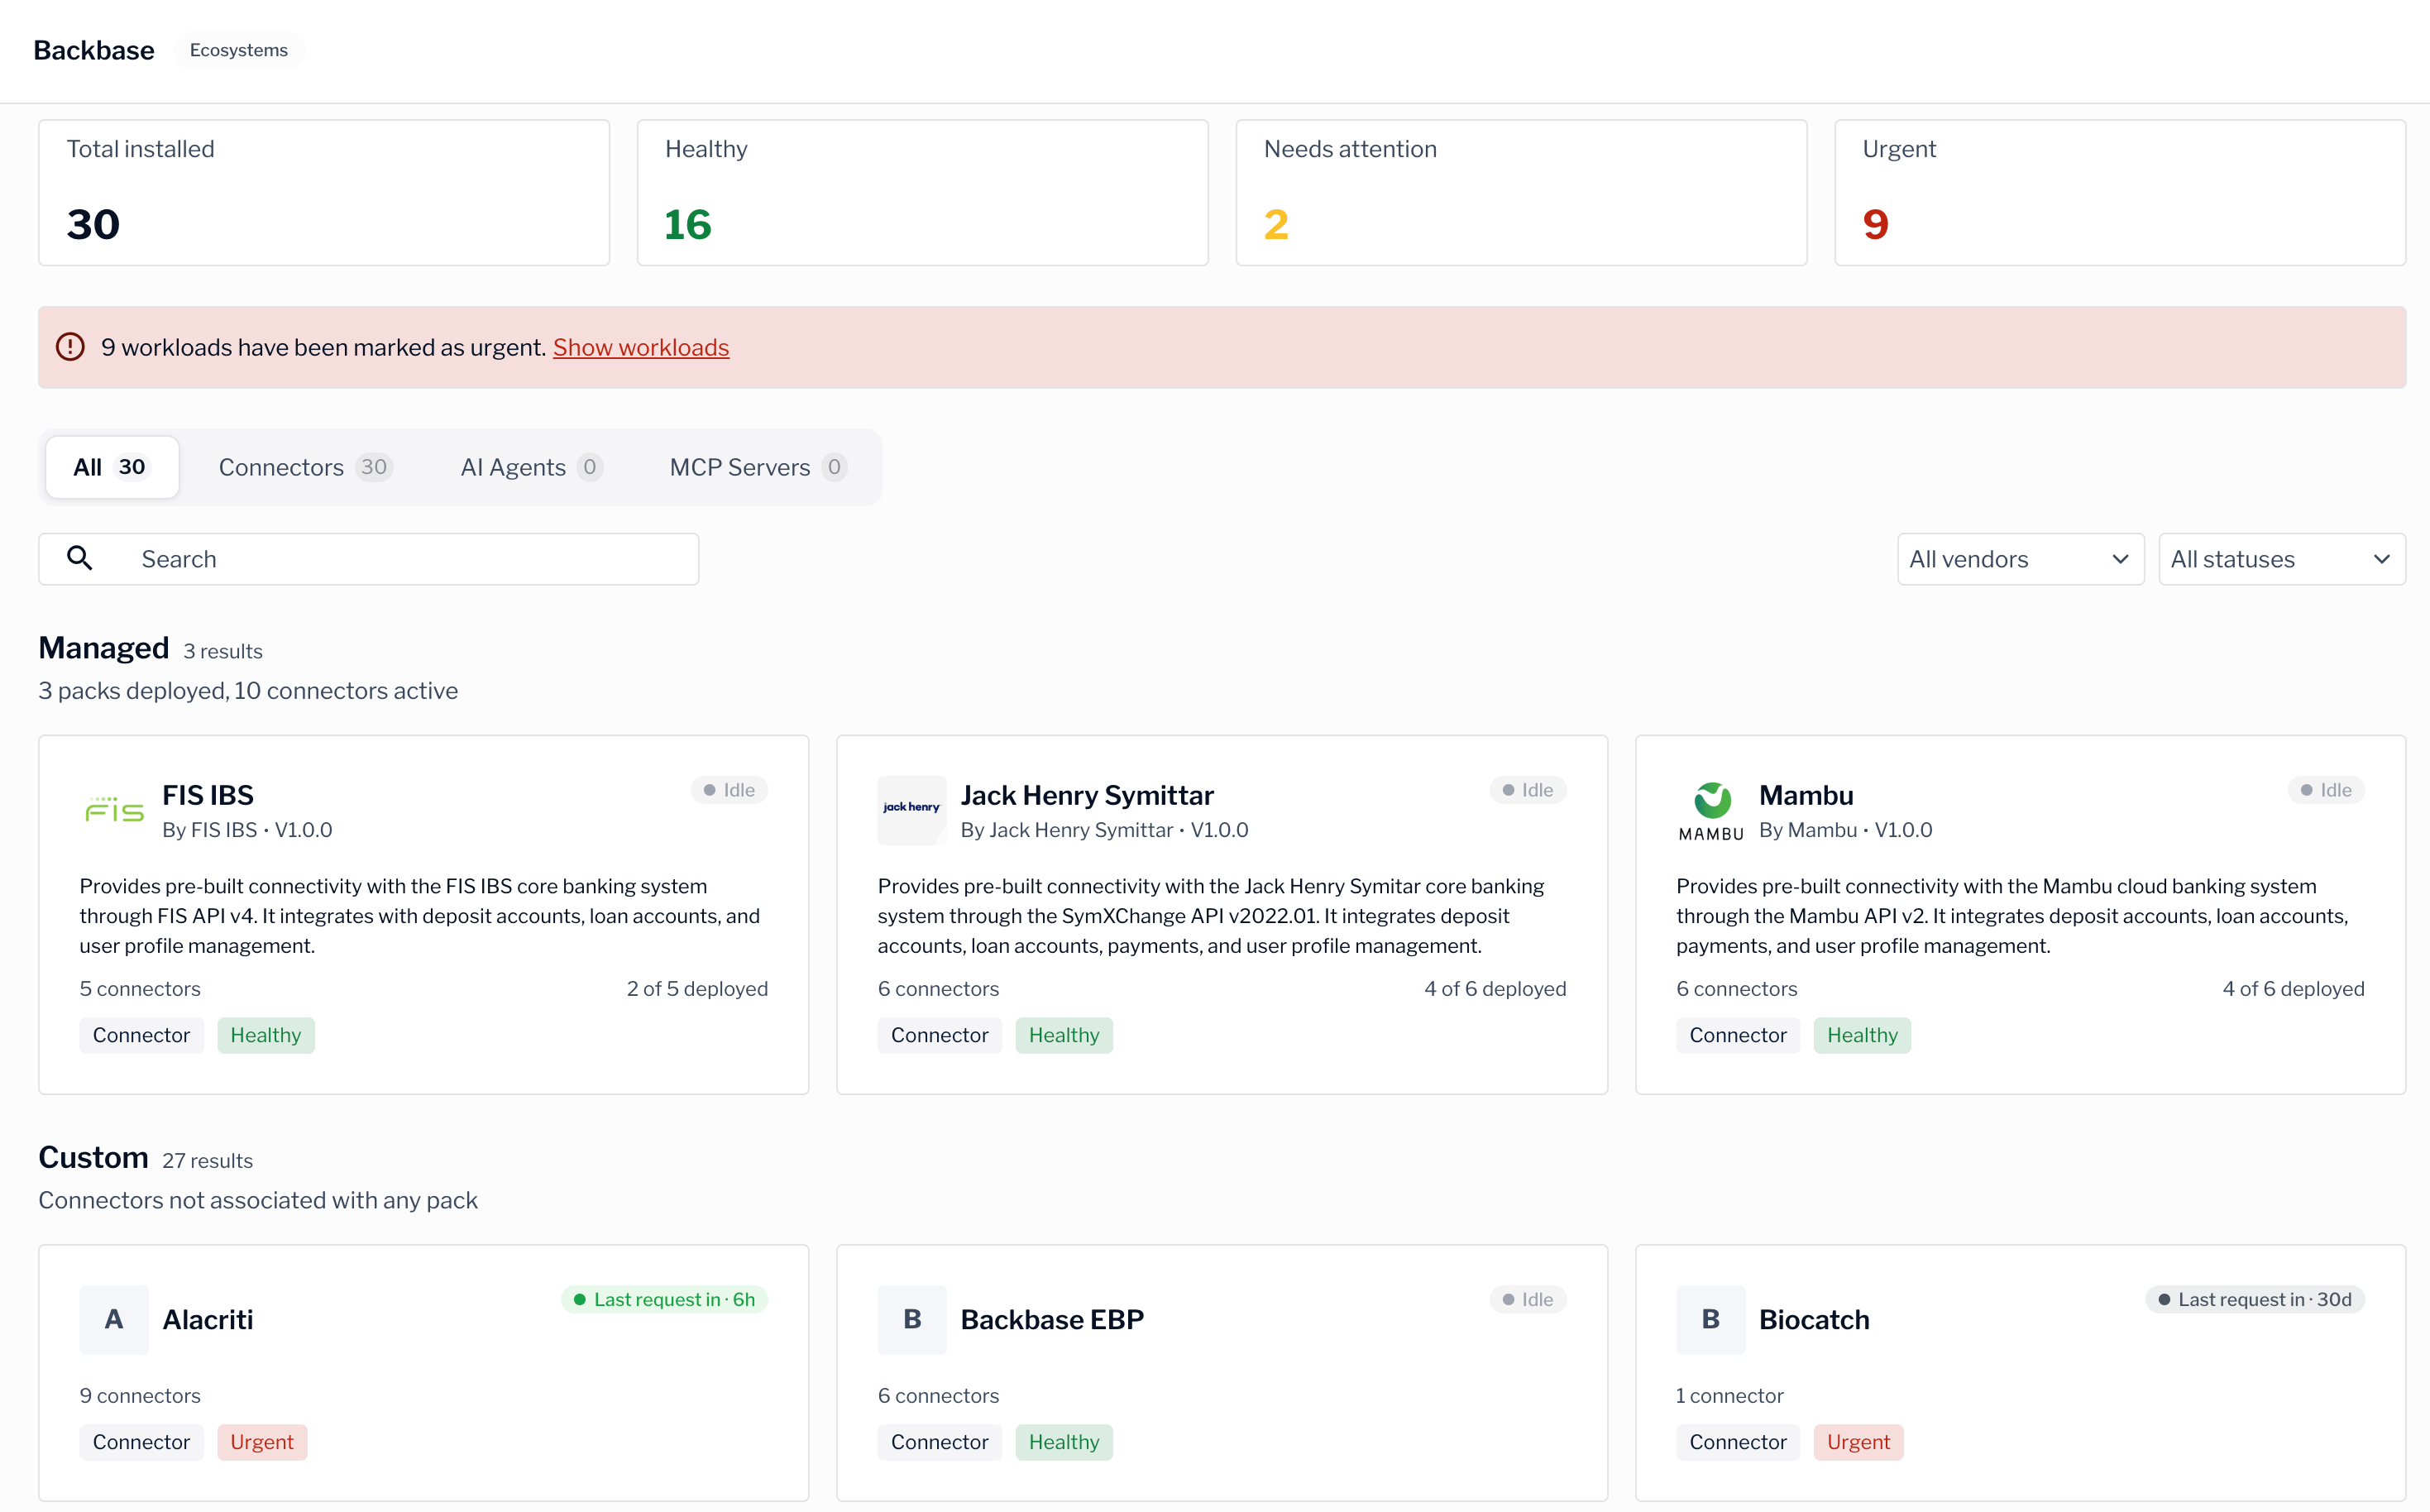
The dashboard is the home of the Grand Central console. It shows the connector packs deployed to your selected runtime and the current health of each connector, so you can tell at a glance whether your integrations are running as expected.
## Read the dashboard
The dashboard lists each deployed pack with a summary of its connectors. For every pack, you can see how many of its connectors are deployed, shown as a count such as `Deployed 3/4`.
Use the filters at the top to focus on a specific type of item. The following filters are available:
* **All** shows every item in the runtime.
* **Connectors** shows deployed connectors.
* **AI Agents** shows AI agents.
* **MCP Servers** shows MCP (Model Context Protocol) servers.
## Connector health
Each connector shows a health status so you can spot problems quickly. The following table describes the statuses.
| Status | Meaning |
| :------------------ | :----------------------------------------------------- |
| **Healthy** | The connector is running normally. |
| **Needs attention** | The connector shows warnings that you should review. |
| **Urgent** | The connector has a serious problem that needs action. |
Sort or scan by status to find the connectors that need action first. A connector marked **Urgent** is the best place to start.
## Drill into a pack or connector
The dashboard is the starting point for a two-step drill-down:
1. Select a pack to open its details and see every connector in the pack, its health, and whether it's deployed to your runtime.
2. Select a connector in the pack details view to see its metrics over time.
For more information, see [View a pack's connectors](/grand-central-app/packs) and [Connector health and metrics](/grand-central-app/connector-health).
## Next steps
Open a pack from the dashboard to see its connectors.
Dig into the metrics for a single connector.