

Open a connector
To reach a connector’s metrics, start from the dashboard:1
Select a pack
On the dashboard, select the pack that contains the connector you want to review.
2
Select a connector
In the pack details view, select the connector. The console opens the connector’s health and metrics.
Understand the health status
Each connector carries one of three health statuses. The following table describes what each status means and the typical next step.Read the metrics
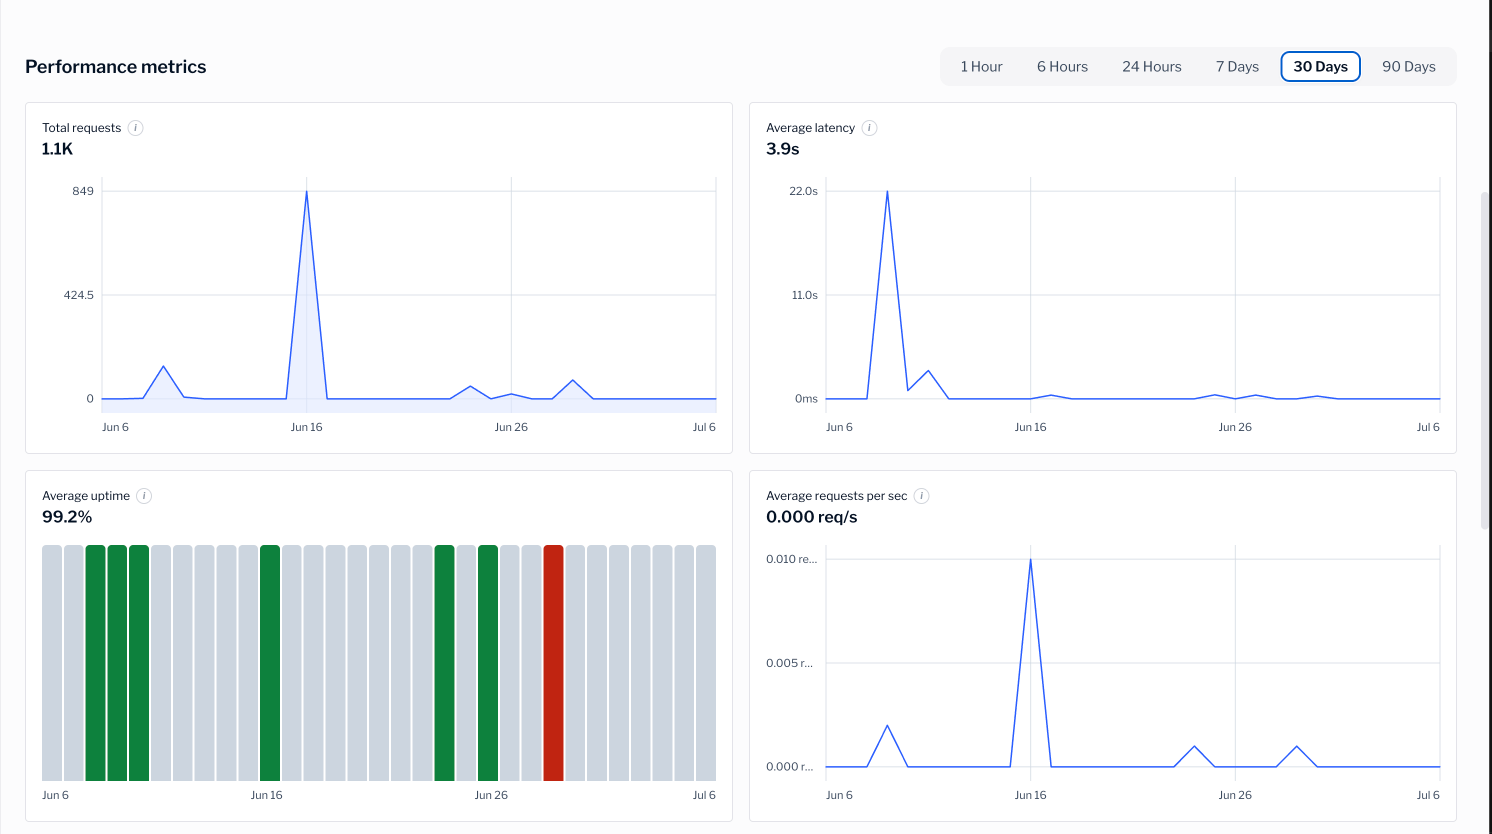
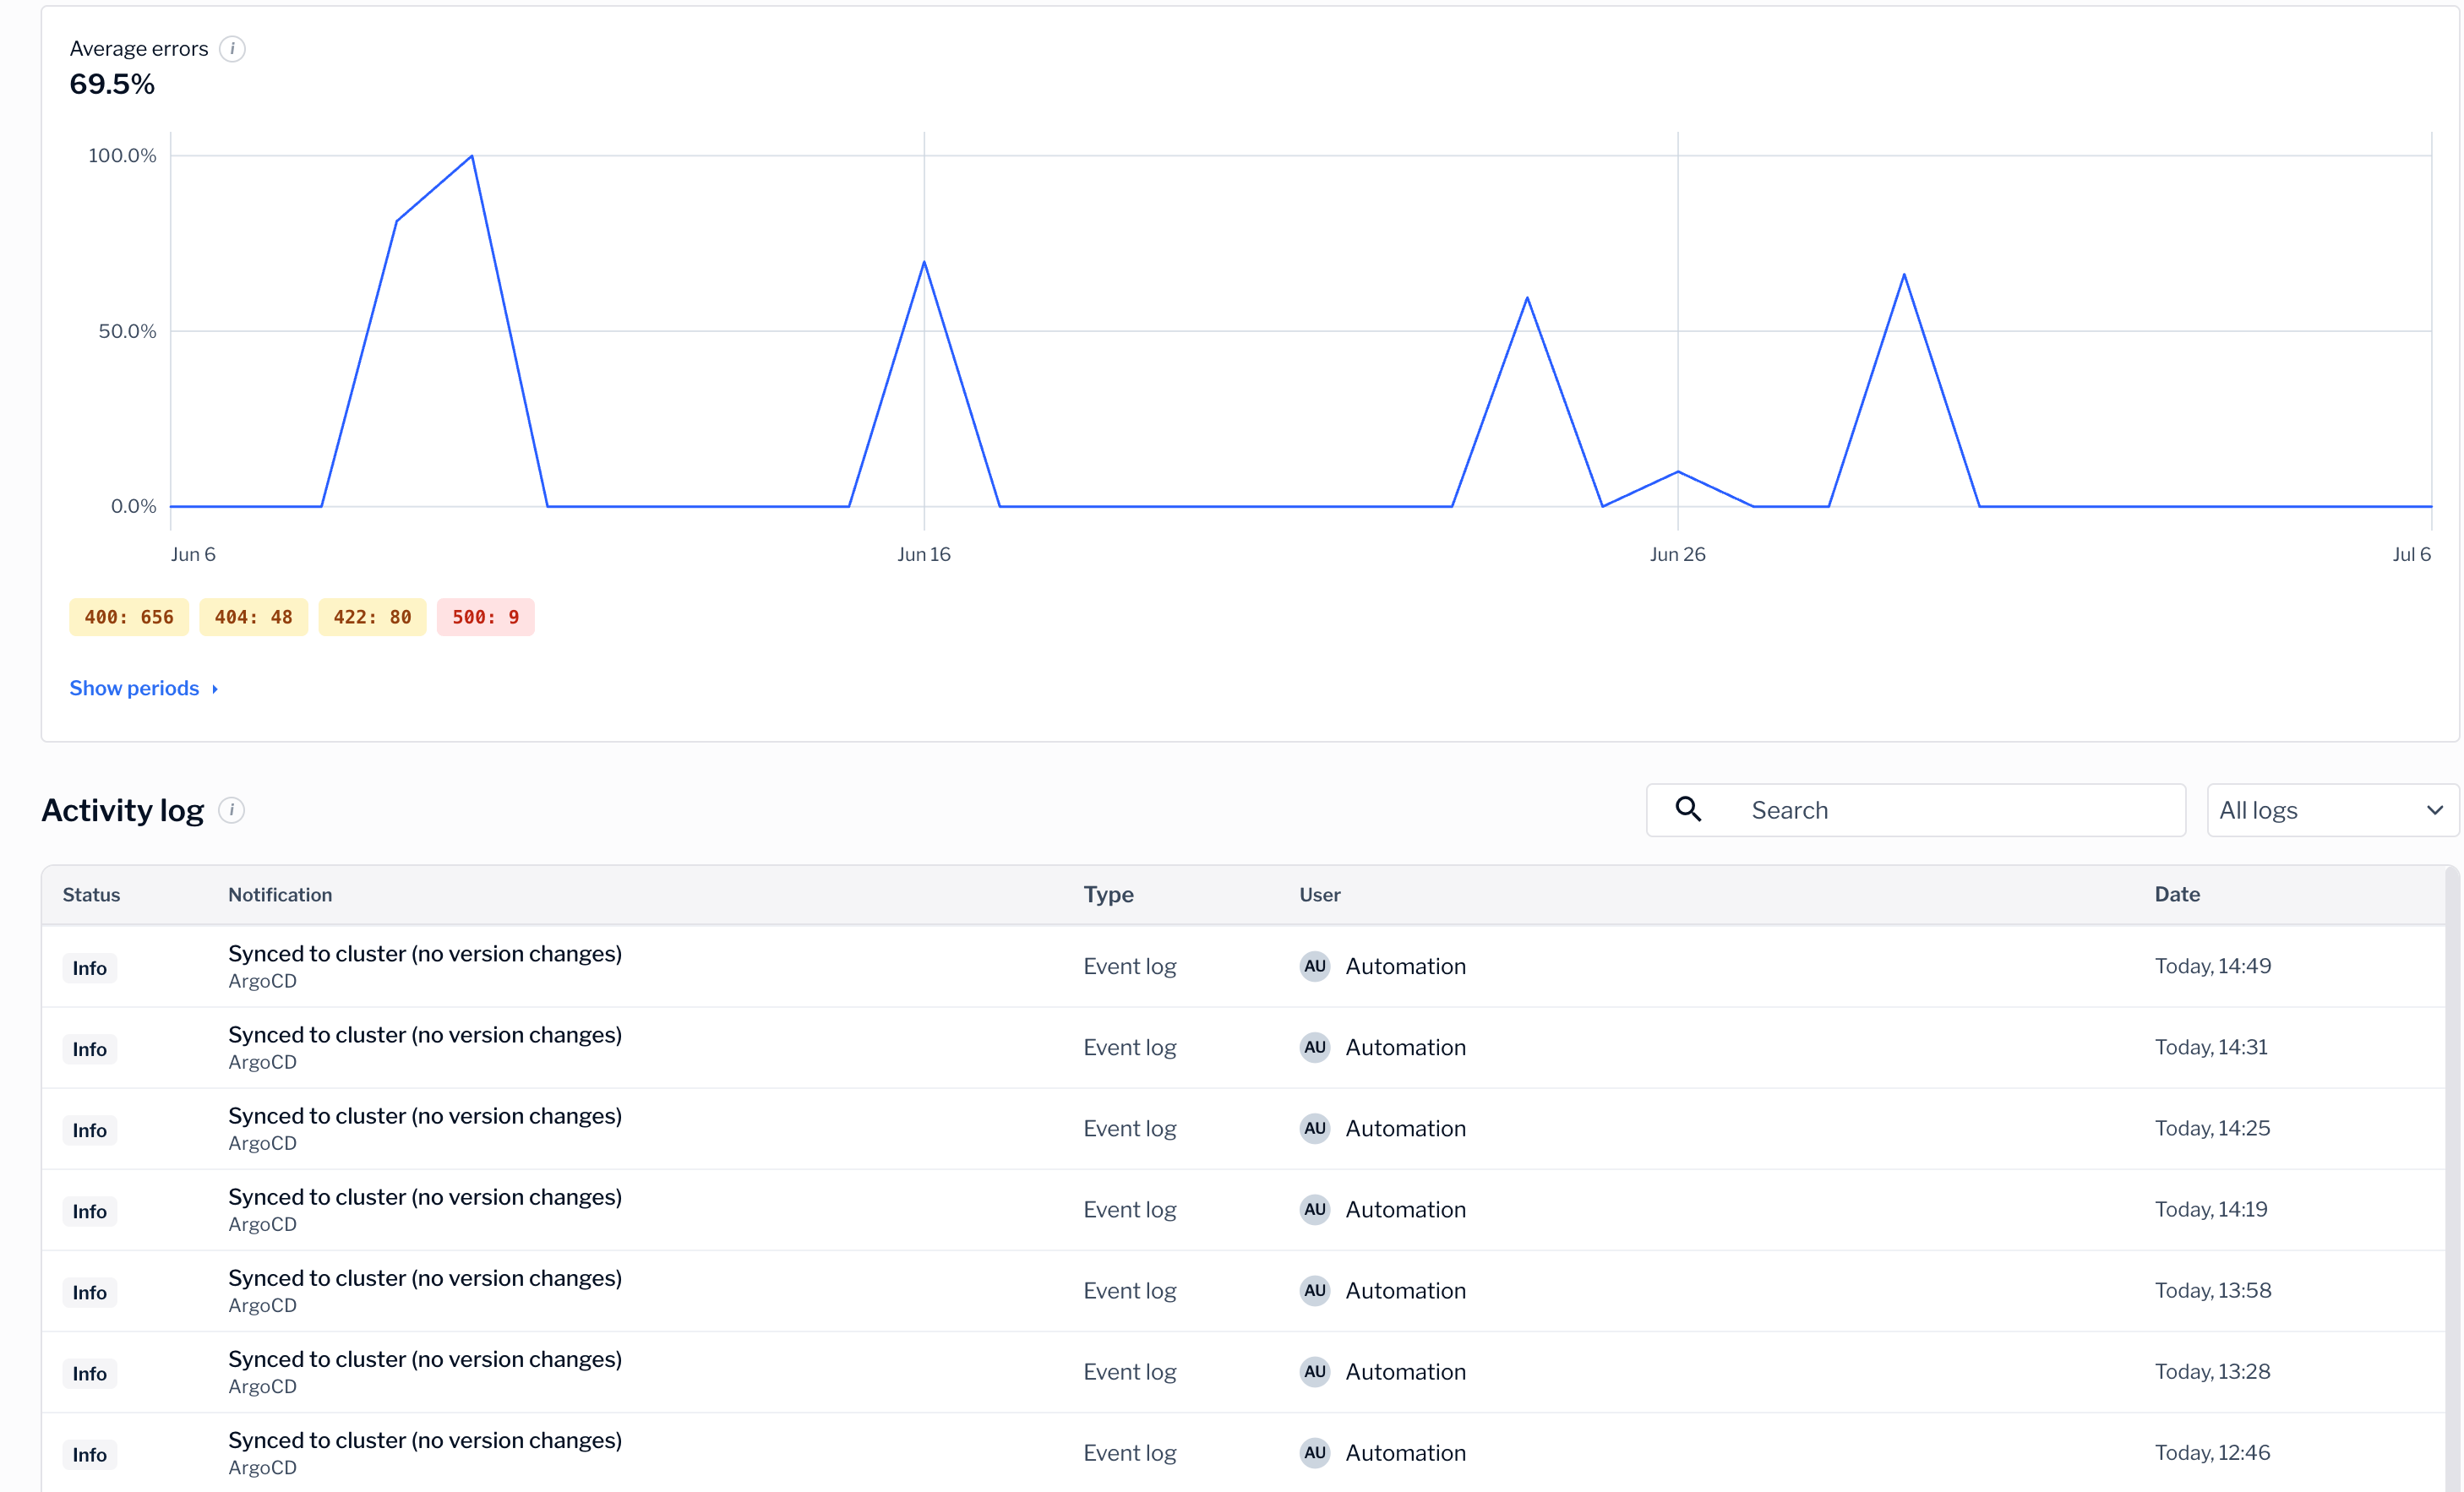
The connector view shows metrics over a time range, such as request volume and error rates. Use the metrics to answer questions like these:- Did errors start at a specific time?
- Is traffic higher or lower than usual?
- Has the connector recovered after a change?
Metrics reflect the runtime you selected when you signed in. To review a different environment, switch runtimes and open the connector again. For more information, see Sign in and select a runtime.
When to escalate
If a connector stays Urgent or its errors keep climbing, contact Grand Central support. Share the connector name, the runtime, and the time range where you first saw the problem, so the team can investigate faster.Next steps
Back to the dashboard
Return to the dashboard to review the rest of your connectors.