

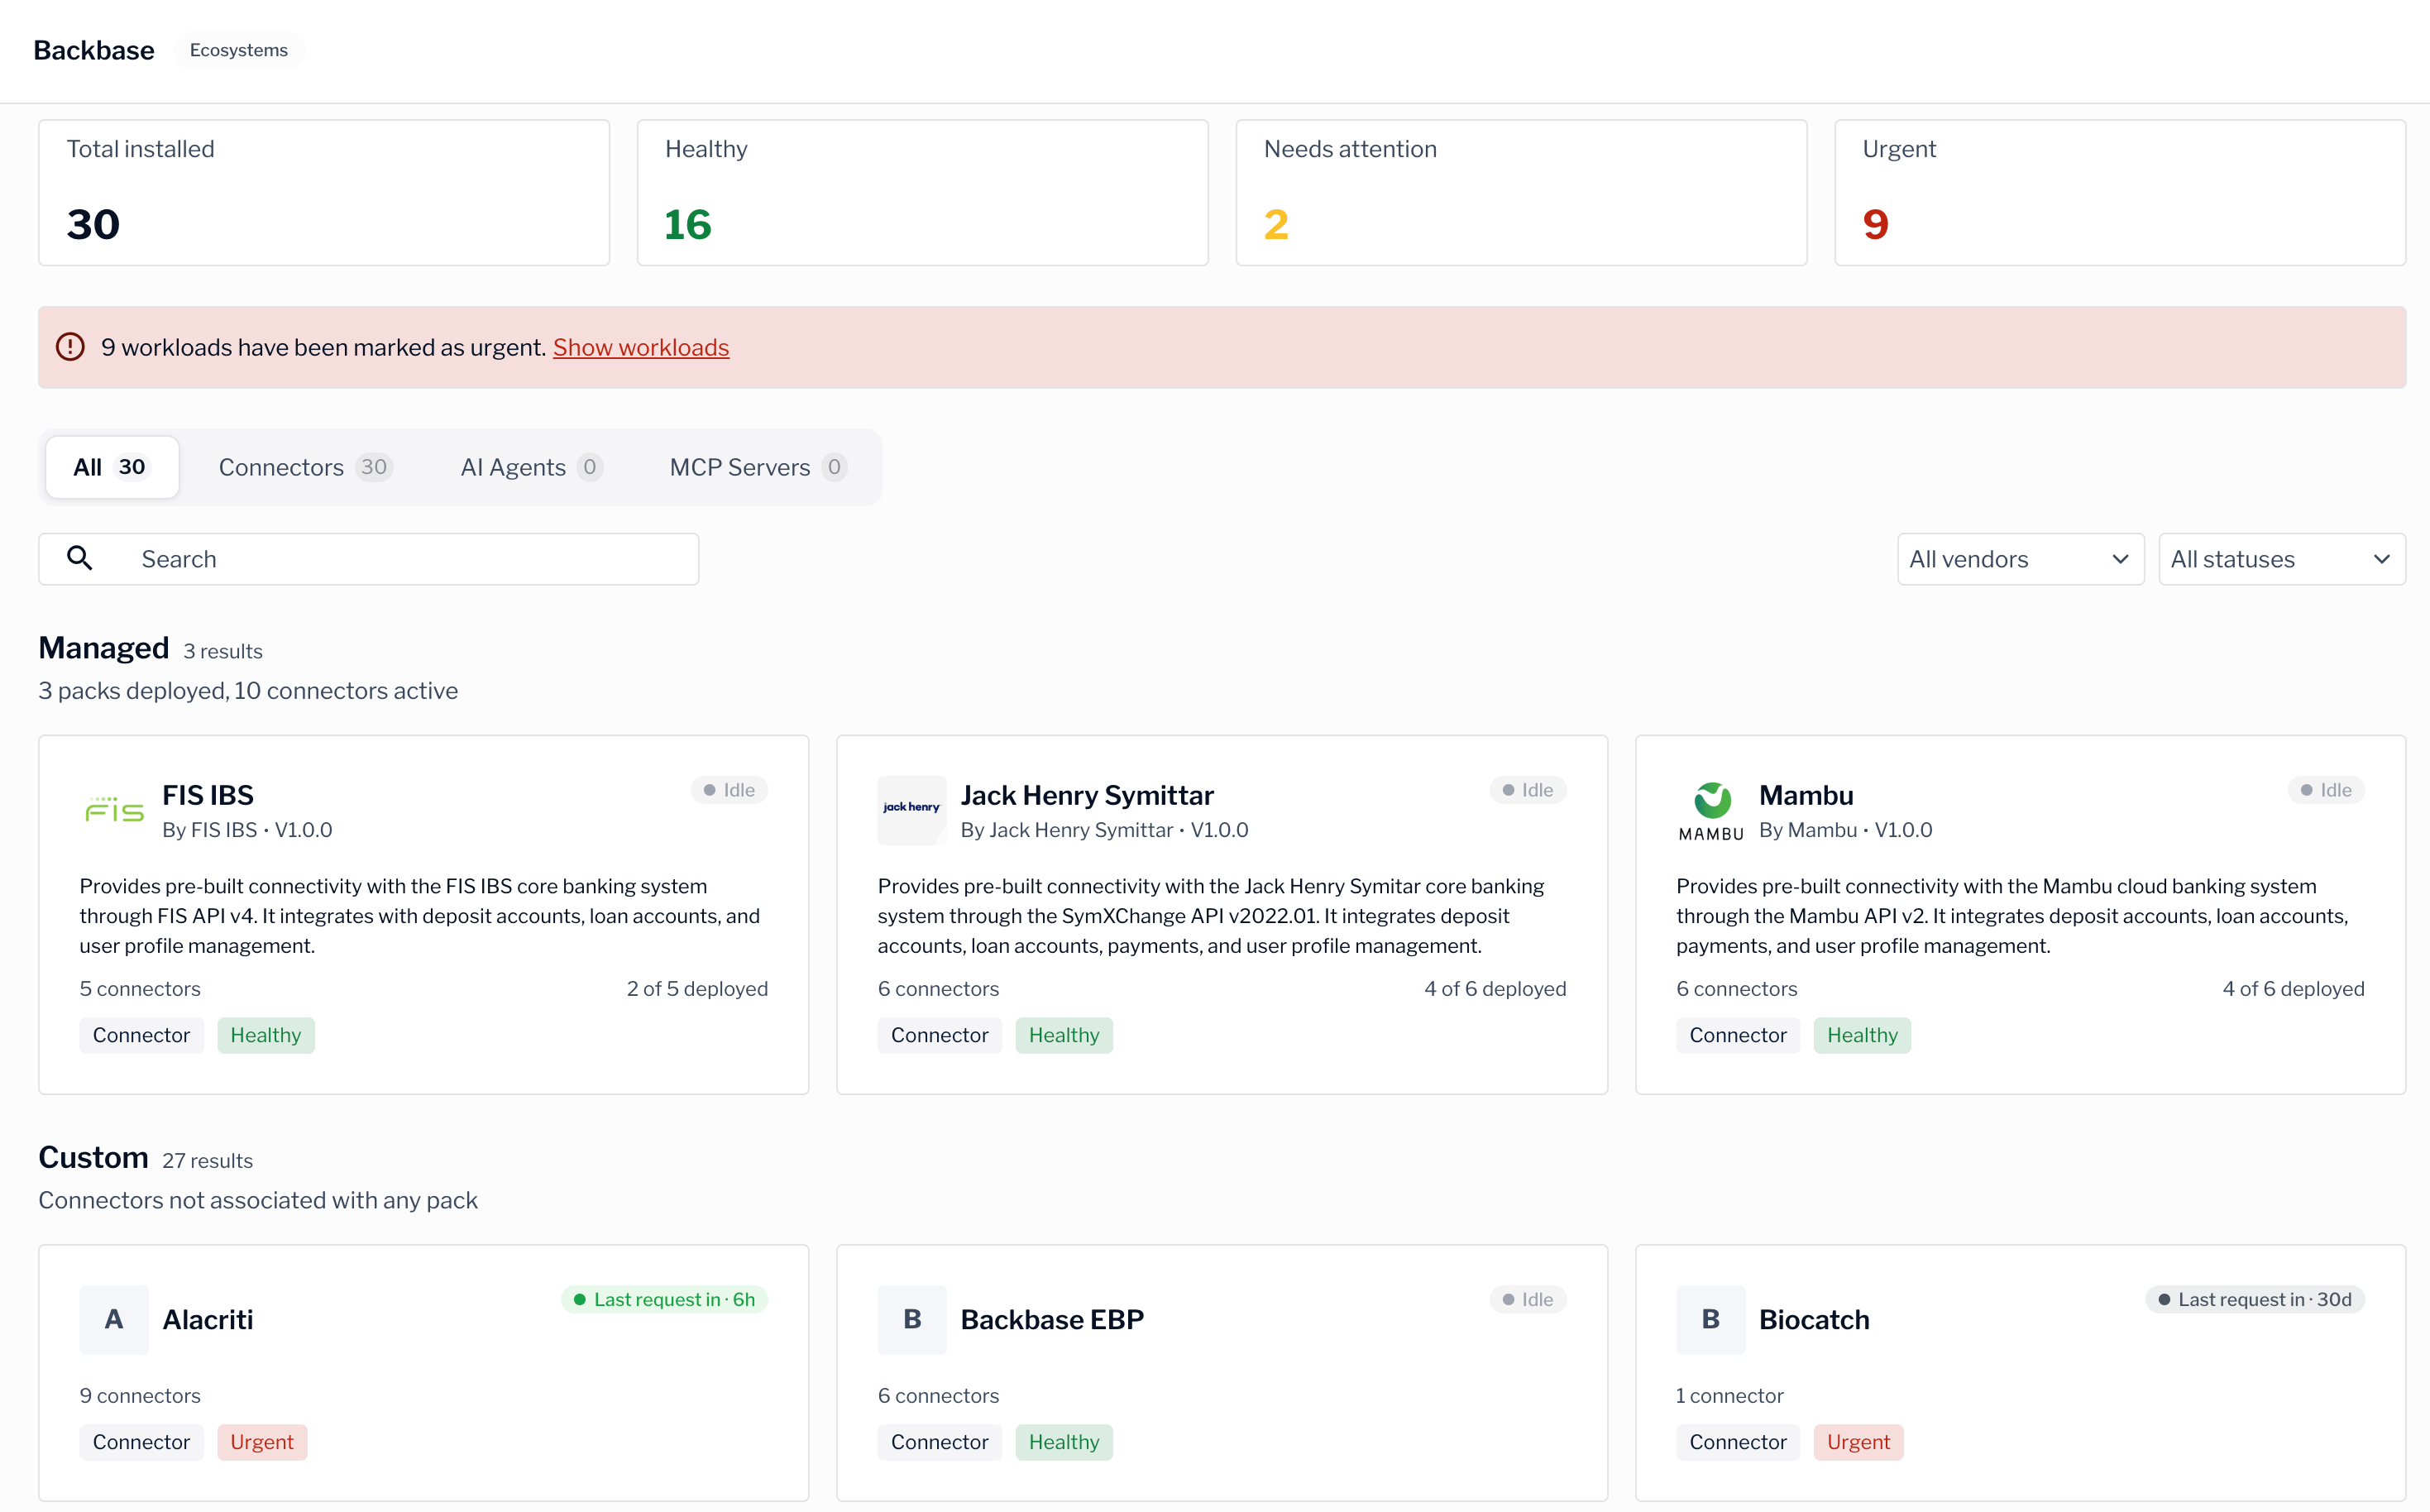
Read the dashboard
The dashboard lists each deployed pack with a summary of its connectors. For every pack, you can see how many of its connectors are deployed, shown as a count such asDeployed 3/4.
Use the filters at the top to focus on a specific type of item. The following filters are available:
- All shows every item in the runtime.
- Connectors shows deployed connectors.
- AI Agents shows AI agents.
- MCP Servers shows MCP (Model Context Protocol) servers.
Connector health
Each connector shows a health status so you can spot problems quickly. The following table describes the statuses.Drill into a pack or connector
The dashboard is the starting point for a two-step drill-down:- Select a pack to open its details and see every connector in the pack, its health, and whether it’s deployed to your runtime.
- Select a connector in the pack details view to see its metrics over time.
Next steps
View a pack's connectors
Open a pack from the dashboard to see its connectors.
Connector health and metrics
Dig into the metrics for a single connector.